
One thing often hidden behind a person’s CV is the amount of rejection that comes with succeeding in science, regardless of how a person is trying to succeed (publish a paper, get a job, obtain a grant, etc). Below is a graphic showing the history of my published and unpublished papers and their rejection histories.
My hope is by sharing this kind of information , we can all realize that rejection is our constant companion, and while its totally fine to be disappointed, its not a reason to doubt your abilities.
Publications
For those who are less familiar with academic publishing, a desk rejection is where the editor of the journal rejects the paper without sending it out for peer review (often because they do not think it fits with the scope of the journal).
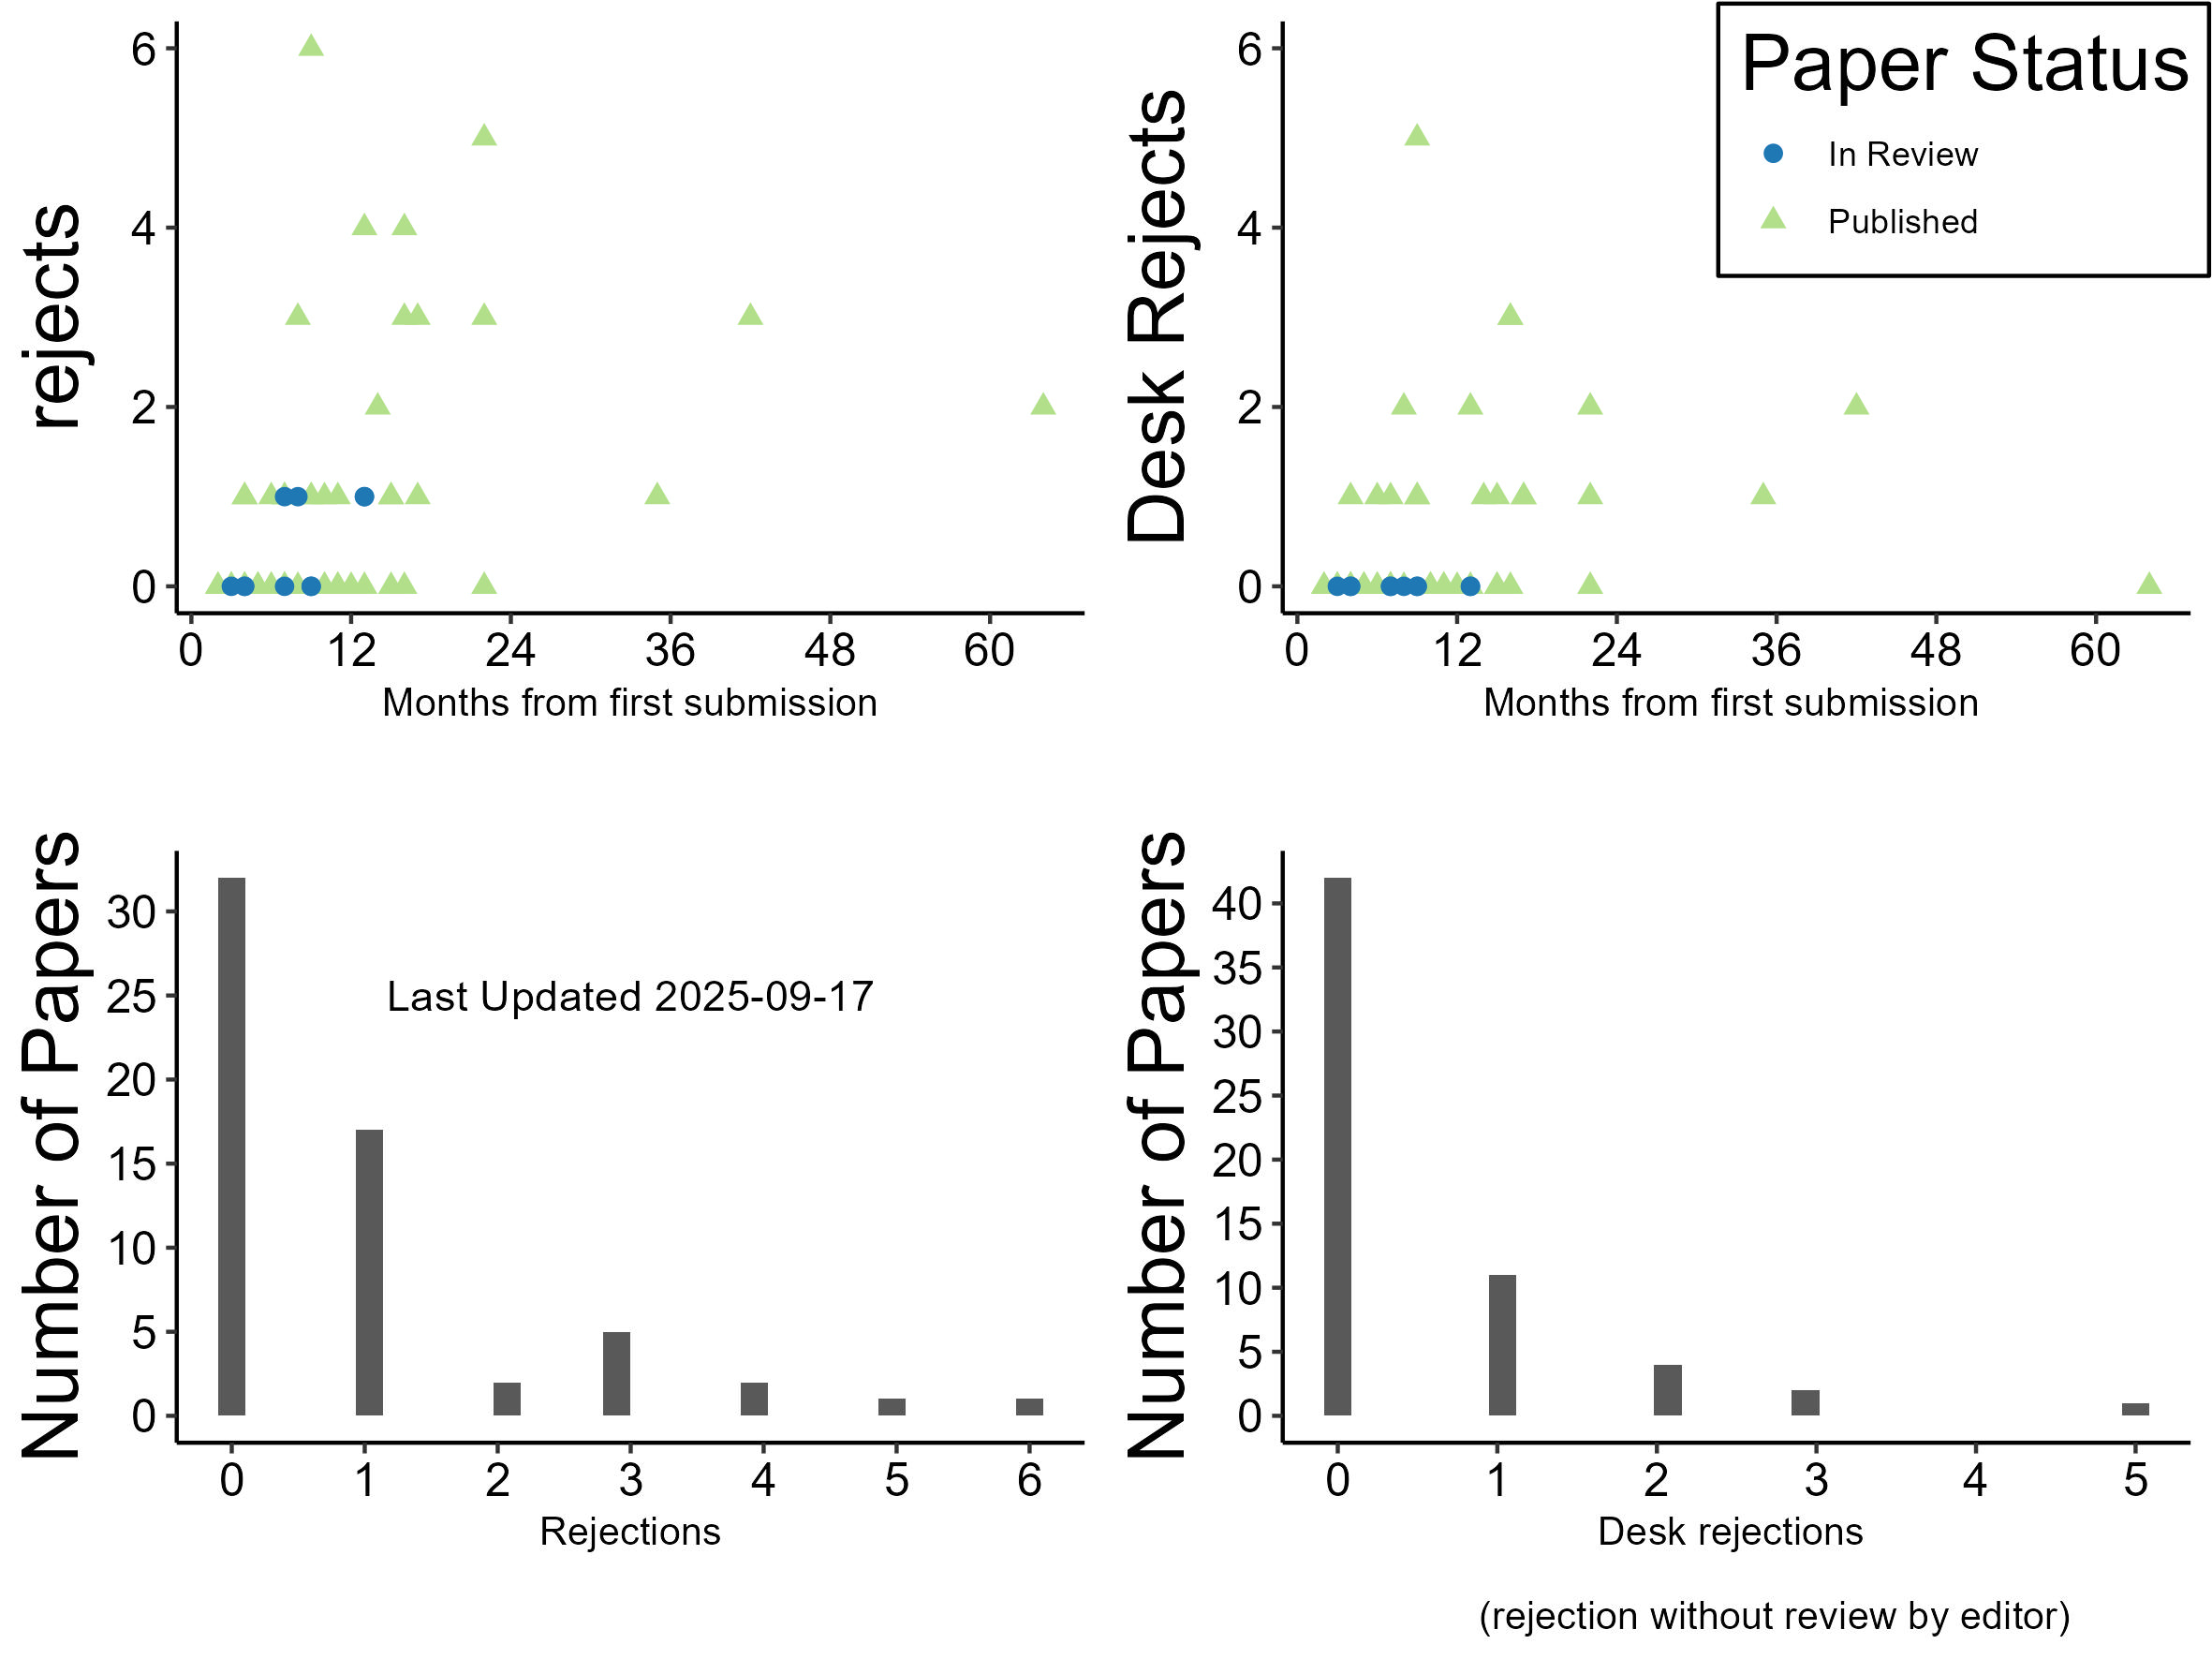
Image Description -Four panel figure, Upper left, scatterplot of months on x axis, rejections on y. Lower left, histogram of rejections on x axis, count on y. Upper Right, scatterplot of months on x axis, desk rejections on y. Lower right, histogram of desk rejections on x axis, count on y.
Tabular data included in the graph
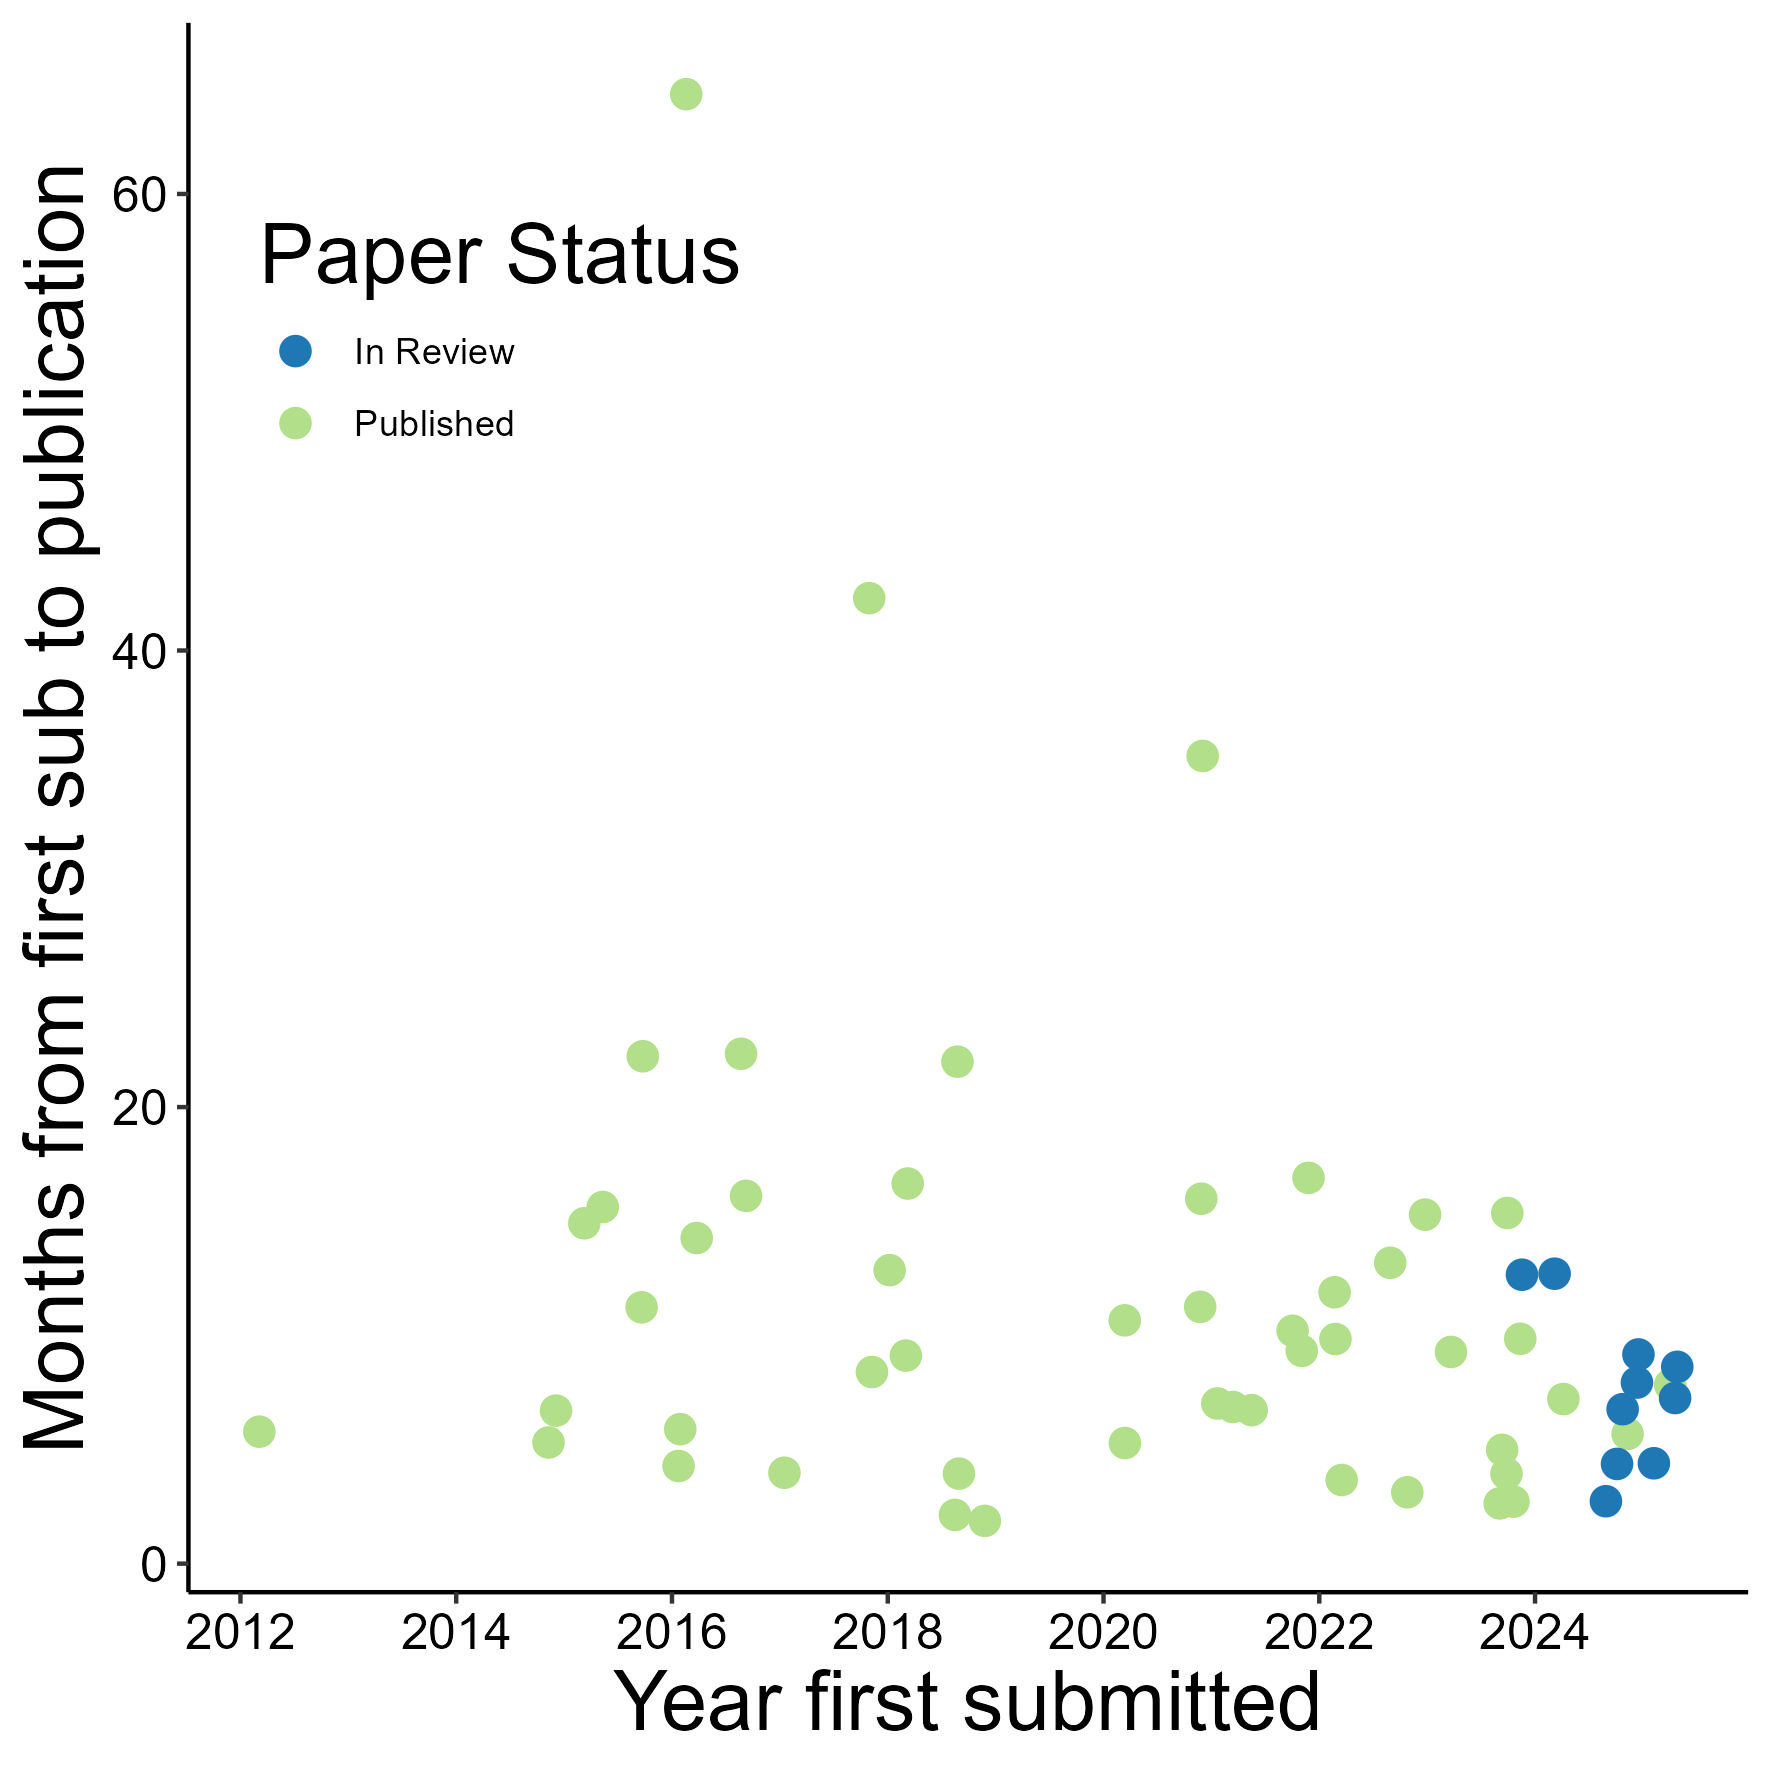
It doesn’t appear that things are changing much over time, with time being the year a paper was first submitted. Some papers find a home pretty quickly, others take (or are taking right now) a very long time.
Grants
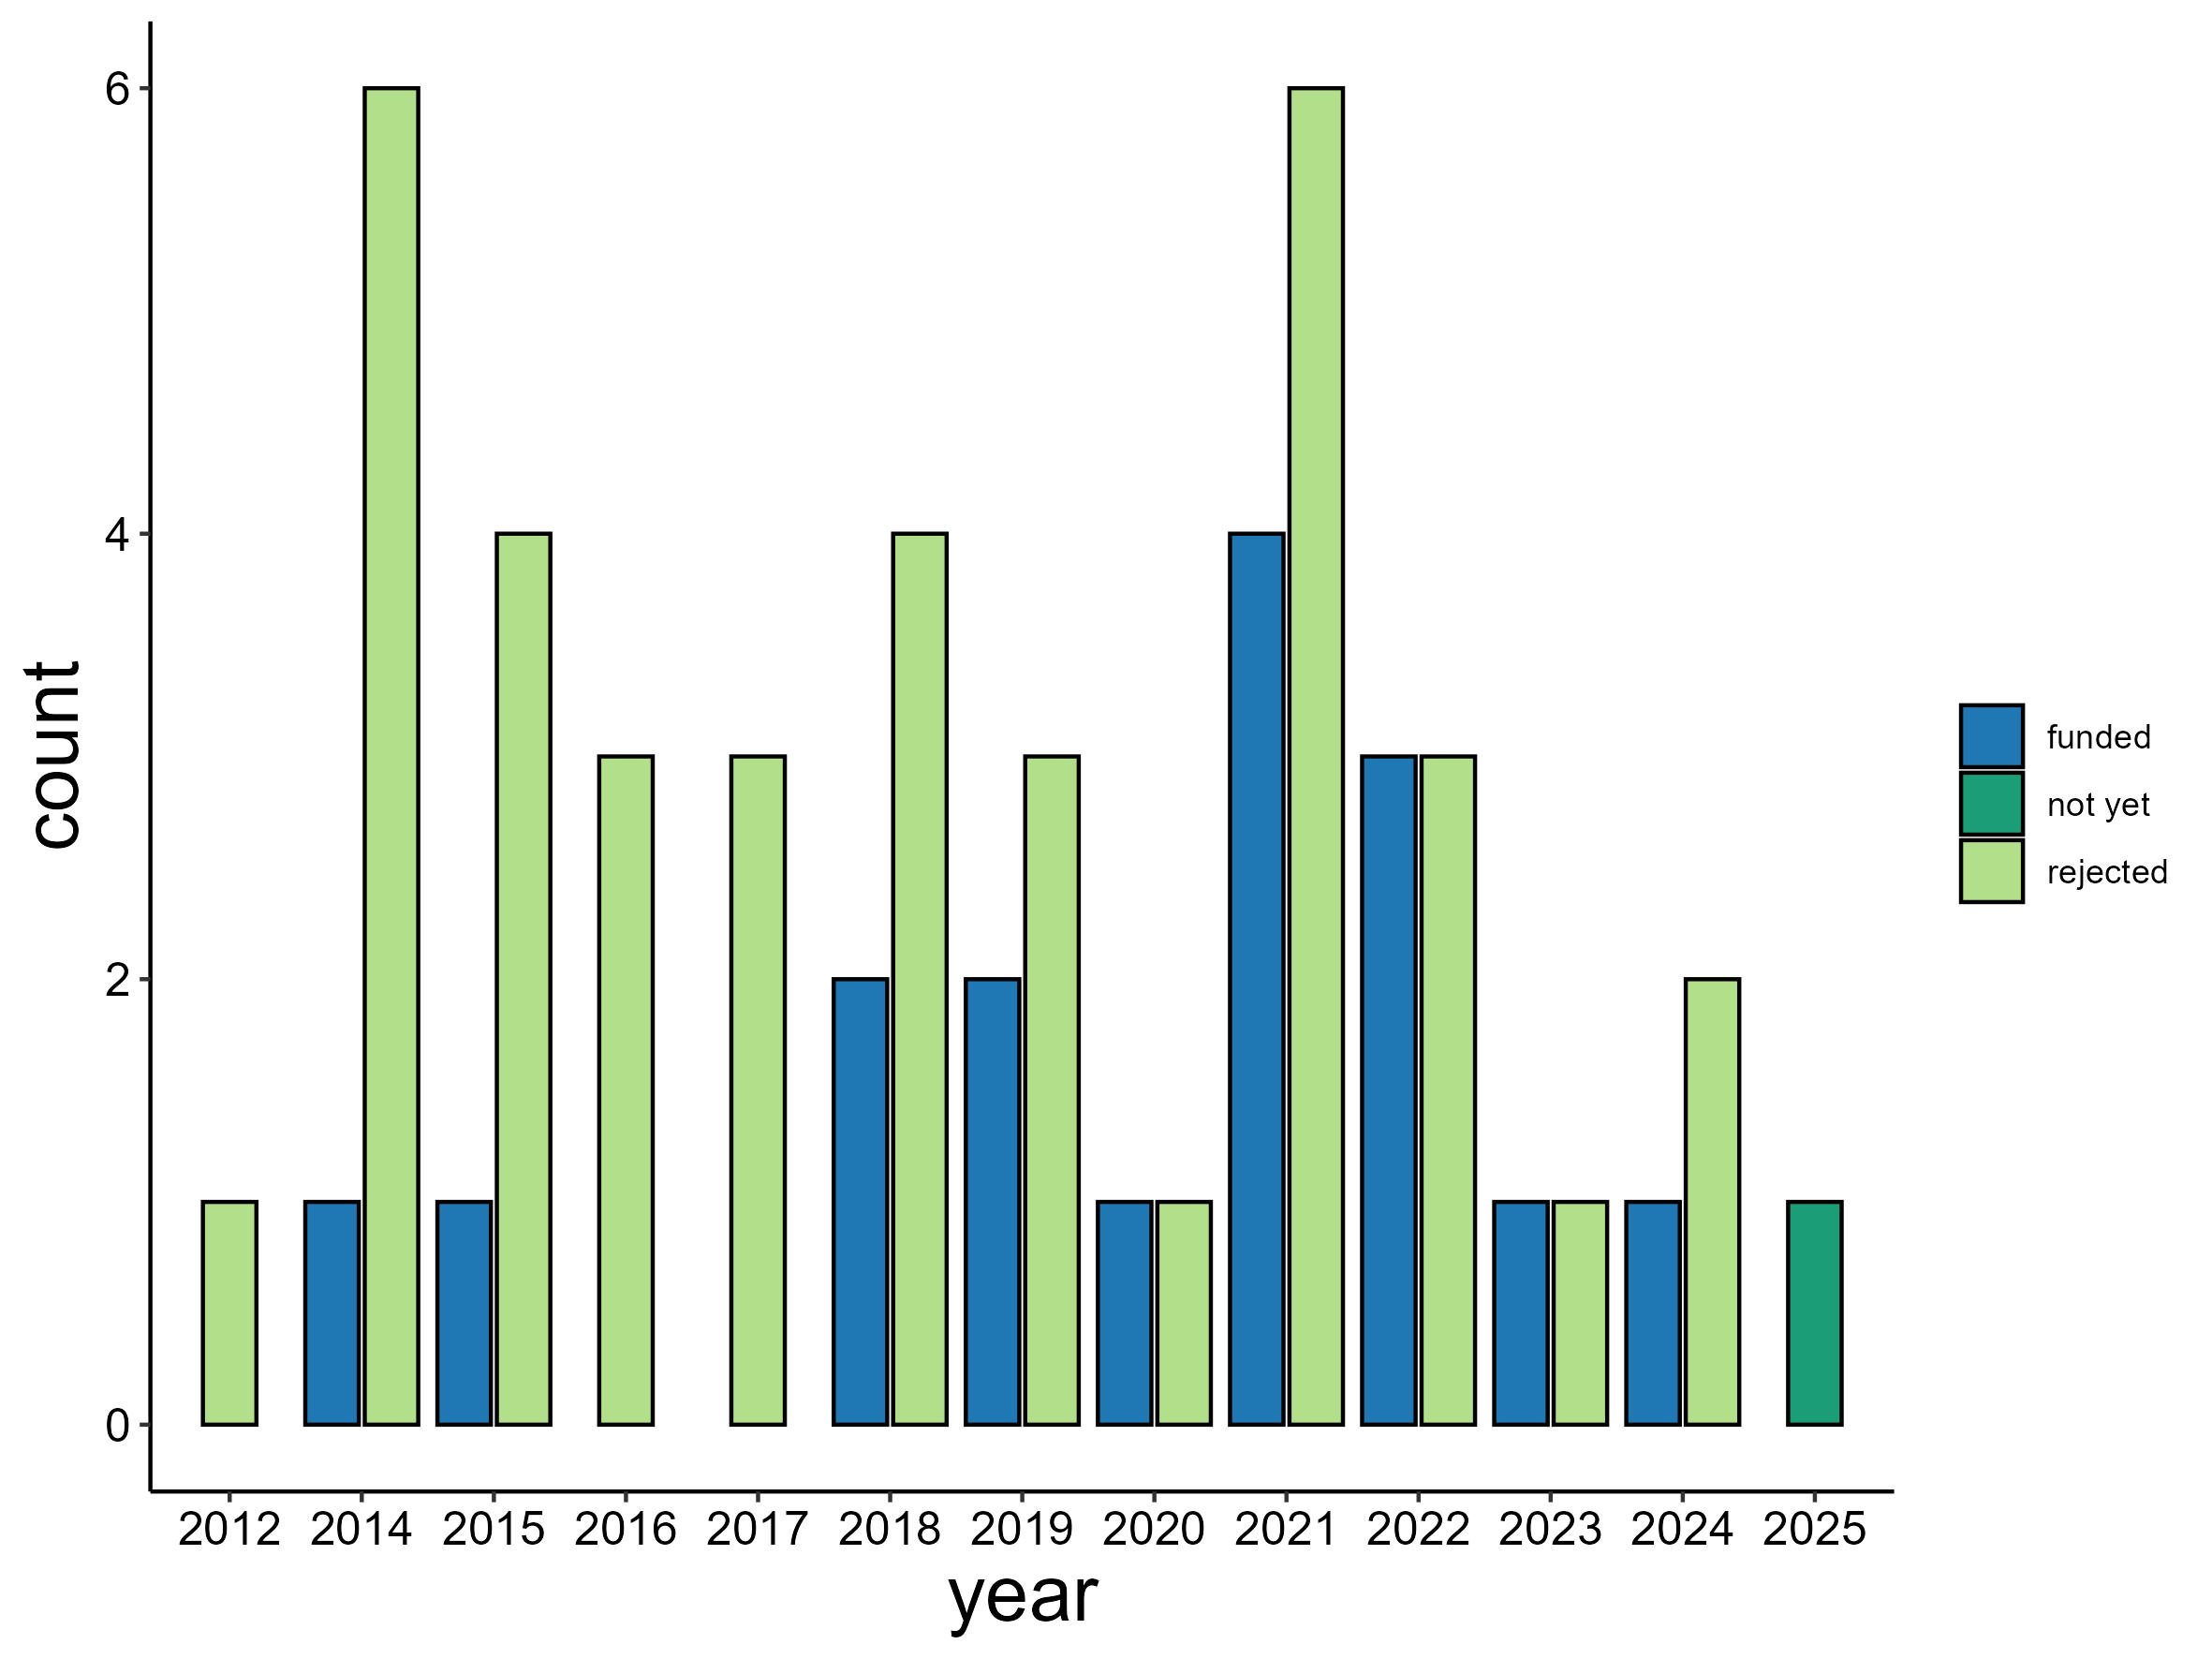
Image Description Bar chart showing year on the x axis, and count on the y, with the bars grouped into grants which were rejected, those which were funded, and those which have not yet been rejected. The vast majority, have been rejected.
Tabular data included in the graph
Jobs
For info on my two post-PhD job hunts - see this post